Display Reporting Services usage statistics with Grafana

Introduction

In this post, we will describe an efficient way of showing the usage statistics of our SQL Server Reporting Services hosted reports. Most of the queries below have been addressed in another article published by Steve Stedman. Even though they are really useful, the article shows their results through SQL Server Management Studio.

The problem

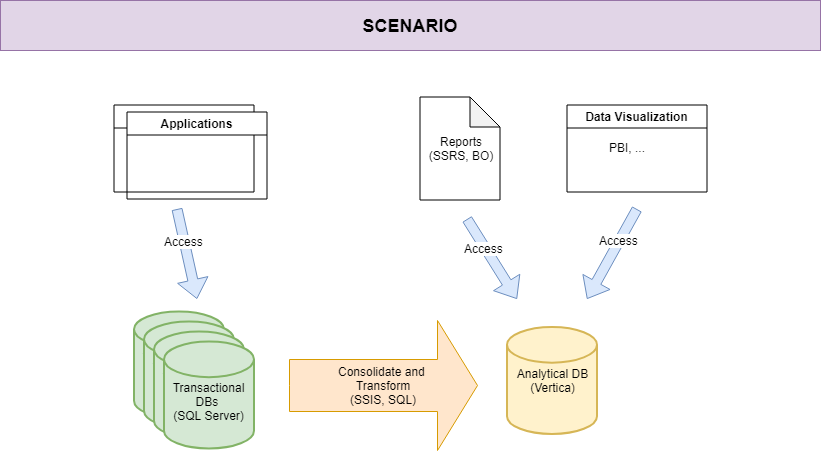
One of the problems that often occur in our organization as well as some of our customers, is to get immediate feedback about usage statistics of reports. Usually, the request of creating reports is out of control and some of them are executed only “that time” and not anymore. In the worst-case scenario, many of them aren’t executed at all and some of them could become even overlapped or duplicated.

Therefore, it is important to know the usage statistics, user by user and report by report, to make the reader aware of them, let him interpreting the values of the same query in multiple ways and graphical layouts. While this is not possible with a tabular format (unless you export the values using any external tools such as Excel) it is simpler when it comes to a dashboard.

Our solution: Grafana

We considered two factors: simplicity and efficiency, in order to make this first-sight dashboard. Grafana enables us to get both of them, as well as being very powerful and immediate. Even though this is not the right definition for it, we can say that “it is a portal to create dashboards using connectors, which support the most famous tools that return data”. We can find them in its marketplace. For instance, tools such as PRTG and Prometheus (monitoring), NewRelic (APM), also SQL and NoSQL data sources are supported:

Obviously, we can find SQL Server. Also, we can contribute to create others, as well as to modify Grafana itself, since it is completely an Open Source project. Examples of possible graphical representations are listed below:

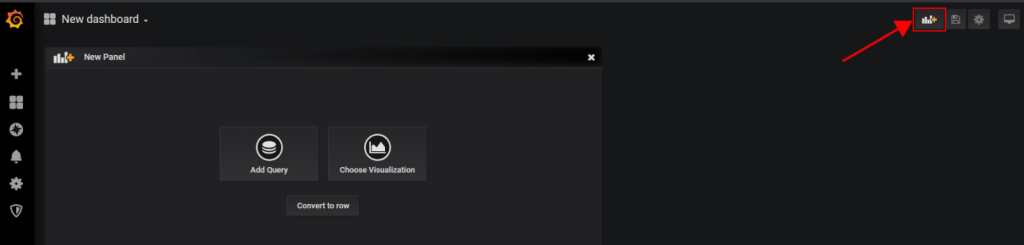
Creating a dashboard is really simple. Just add each panel with a button.

Then, write the query and modify settings to get the desired type of representation.

As mentioned before, the connectors are many. Once selected you can to configure them with parameters:

If you would like to install and configure Grafana you can read the official documentation which also includes a short guide that illustrates how to take your first steps.

That’s it!

Conclusions

With half a day of work (including the setup of the server), we have solved one of the most important problems of our customers, derived from the lack of awareness of reports deployed in production environments. We did it with very little effort and the result, as you can see, is pleasant and effective. Everything is now ready to be published every time we update the dashboards also through a delivery software (Octopus Deploy, Jenkins or Azure DevOps) so all these things fall into the second and third way of DevOps (according to The Phoenix Project): Immediate Feedback and Continuous Improvement.

Stay Tuned!

DevOps journeys series – Vertica release pipeline with Azure DevOps – Ep. 01 – development (part 1)

Intro

As a consultant, life could be difficult when it comes to manage platform like Vertica, a columnar RDBMS by MicroFocus. Speaking about DevOps, database management systems like this one neither is well supported by built-in tools nor by any third party suites.

In my experience, which is focused on the Microsoft SQL Server world, tools like the ones made by Redgate or ApexSQL, plays a crucial role when it comes to DevOps. Unfortunately, this time I cannot find any real help. I think that it’s an exciting task, but I’ve to be careful. It’s like “reinventig the wheel” for a car (Vertica) that didn’t realize that it needs wheels. Strong and reliable wheels.

Scenario

In the scenario I’m working on, the data warehouse is managed by a layer of business logic implemented within this platform. Starting from SQL Server database populated by the application layer, the data rows pass through SQL Server Integration Services ETL packages, which transform them onto Vertica repository, and they end into a Business Objects layer (the presentation layer). Just to get the big picture, see the following diagram:

bi-scenario-scenario

Our mission is to share DevOps knowledge, culture and tools in order to automate a set of processes which are managed manually, right now. Not a simple task, even if the guys I’m cooperating with are well-trained and powerful in tech skills. Additionally, they are enthusiast and ready to change (and we know how this is usually a trouble). We will get obstacles only from a technology perspective, actually.

After days of documentation and questions to our MicroFocus contacts, it looks like that Vertica gives us no built-in way or tool for getting an automated process during the phase of the schema comparison. Also third-party tools aren’t that good. We’re trying to dig more and more in order to find out something on the internet. However, everything it’s a “little bit” tricky. To be honest it seems that no one tried to do DevOps with Vertica, even though this is a very good platform for speeding up heavy queries on huge amount of data. Yes, we downloaded a couple of officially suggested tools, whose documentation says that we can compare from and to Vertica itself, but no one fits our scenario. No command lines, no direct integration, no script generation. If you think about automated pipelines, this can be a big problem to deal with. I think that this should be the foundation of a DevOps approach. In the end, it looks like we’re the the first team that is trying to invest efforts into that. It’s funny, though. Hopefully, someone with experience in Vertica DevOps who reads this post could help us!

(After digging more, I’ve found this article that describes almost the same scenario. I hope to reach out the author out).

Prerequisites

As a kick-off, we’ve moved into the prerequisites, starting from the most important thing: make a process that will facilitate the team’s workday, instead of wasting time due to bad choices. This process should be simple and automated.

Then, we’ve argued about the IDE used by developers, evaluating differences between before and after solutions, getting pro and cons of them all. In the end, we agreed on the following solution, development side:

  • Visual Studio 2017 will be the editor for SQL Server Integration services solutions. This team, “BI team” hereafter, is working on SSIS and is separated from the application development team, at least at the moment;
  • TFVC (Azure DevOps on-premises) will be the Version Control System since the BI team is already using it. We will think about a migration path to git then, but for now we’d like to avoid any distraction out of the scope;
  • every get latest from the source control must synchronize all the DDL scripts for Vertica as well as the SQL Server and SSIS solutions, in order to get a sandbox with source code and the local database provisioning scripts (most likely we’ll get a virtual machine with Unix and a Vertica instance, too);
  • each SSIS project must be deployed to the local SQL Server instance when running solutions into the sandbox;
  • when all the SQL Server Integration Services packages are deployed, the list of Vertica DDL must be executed in order to create the database from scratch;
  • Optionally, mock inserts (also from file) could be added to the database in order to get data to work on.

Our idea

As you can see, in this pipeline, we will get everything we need in our sandbox. Just a note, we can choose how to provision the instance of Vertica, in order to scale out resources from local workstations and also use another O.S. It’s up to the team.

A big picture of this process can be summarized as follows:

001

Conclusions

As we’ve seen, the big picture is ready to be implemented and also the team knows perfectly what are the goals. We already know what technologies will be involved and how to keep them all together in order to make our pipeline.

Unfortunately, we cannot find any tool that helps us, so we’re preparing to jot some lines of code down.

SQL Server Latest Updates (Nov. Dec. 2018)

Directly from the SQL Server Release Service blog, here the latest updates for SQL Server 2016 SP1, SP2, 2017 RTM and 2014 SP2, SP3:

Cumulative Update #1 for SQL Server 2014 SP3

Cumulative Update #15 for SQL Server 2014 SP2

Cumulative Update #12 for SQL Server 2016 SP1

Cumulative Update #4 for SQL Server 2016 SP2

Cumulative Update #13 for SQL Server 2017 RTM

and

Public Preview for SSRS 2017+ Management Pack with Power BI Reporting Server Support

…Stay Tuned, Merry Christmas and a Happy New Year! 🙂

SQL Server Latest Updates (Mar.-Apr. 2018)

Directly from the SQL Server Release Service blog, here the latest updates for SQL Server 2014 SP2, 2016 SP1 and 2017 RTM:

Cumulative Update #5 for SQL Server 2017 RTM

Cumulative Update #6 for SQL Server 2017 RTM

Cumulative Update #11 for SQL Server 2014 SP2

Cumulative Update #8 for SQL Server 2016 SP1

The SQL Server 2016 Service Pack 2 is available here.

You can also download the new OLE DB driver for SQL Server.

…Stay Tuned! 🙂

SQL Server Latest Updates (Nov. 2017)

Directly from the SQL Server Release Service blog, here the latest updates for SQL Server 2016 RTM and SP1 and 2017 RTM,:

Cumulative Update #2 for SQL Server 2017 RTM

Cumulative Update #9 for SQL Server 2016 RTM

Cumulative Update #6 for SQL Server 2016 SP1

Starting from this month, we finally get AdventureWorks on github! The direct location is https://github.com/Microsoft/sql-server-samples/releases/tag/adventureworks

Stay Tuned! 🙂