Every day a DBA (or a developer), has to reply to questions like “who changed that table?” or “who tried to login on our production database?”. These answers are not so simple to find out, actually. LepideAuditor for SQL Server is a tool that can helps us to audit operations on a SQL Server instance and to monitor both the server and the database level.
Minimum requirements
The supported SQL Server versions are:
- SQL Server 2000
- SQL Server 2005
- SQL Server 2008
- SQL Server 2008 R2
- SQL Server 2012
Since the setup creates a SQL Server Agent job, Express editions are not supported. Therefore, it is not possible to use it on a free licensed SQL Server Instance.
Service configuration
The setup process is very simple with its step-by-step wizard. Once the setup is completed, we can execute the program and the following screen will appear:

As you can see, you can navigate the nodes on the left. The first time we execute the tool, no server registration is available, so we need to create a new SQL Server registration pressing “Register New Server…” button. With this, we have to put credentials and server name in order to connect to our instance.
Notes on server name and credentials
For Windows owners (until Windows 7), we can use both local users and sql users (Windows Authentication o SQL Authentication). For Windows 8 owners, we can use Windows Live ID. However, the account we are using must be sysadmin on SQL Server.
Suggestion: use the real workstation name and not the “localhost” string for the server name.
Once the new registration is added, we can use it in order to add the monitors, which will listen to the events that SQL Server will raise. Additionally, the instance node is very important for importing and generating license contracts.
Now we can start to configure the service. Pressing “Start Auditing” button will show the following wizard:
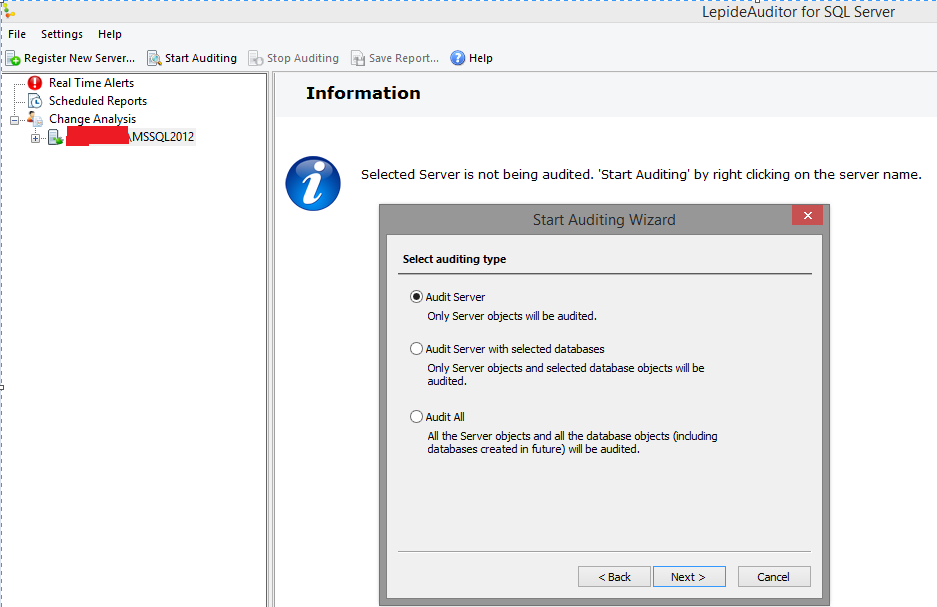
First, we need to choose the auditing type:
- Audit of the server level
- Audit of the server level and a list of selected databases
- Audit of both the server and the databases
Let’s check the “Audit Server with Selected databases” option. This is probably the most common in real cases.
Now, go to the menu “Settings”>“Audit settings”. With that menu, we can setup the options for each audit level:
The server options are:

Note: DTS Package is a legacy naming convention for SQL Server 2000, now DTS is SSIS (Integration Services). However, this option is valid on SQL Server 2000 only.
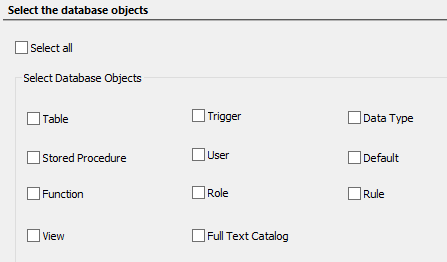
The database options are:

Note: Synonyms are not supported. With “Trigger”, the tool means both DML and DDL. CLR is included on stored procedures, functions and types (Table Valued Parameters).
With “Operations”, we can choose what operation we want to monitor:

This can be the first drawback. These settings will be the same for every database, but it should be configurable for each database in different ways. In addition, the “Operations” section allows us to choose between CREATE, DROP, ALTER and failed logons. It could be better to configure Operations BY EACH DATABASE and Operation by the server instance.
In the “Users” section, we can choose also the login to monitor.
When the configuration is finished, this is how our database will look:

As we can see, we will find:
- An audit database (eventually an archive database)
- Job on SQL Server Agent
- Stored procedure under the master database
- An assembly for the filter engine
The recovery model of the LepideSQLTracker database is set to FULL and the transaction log file is set to a fixed size. This is a thing to pay attention for, because if we do not backup periodically the t-log, we can get an error from the database engine. However, the size limitation is a good practice to follow, because it avoids any unwanted file growth. When the LepideSQLTracker database reaches its log file maximum size, it will be set to RESOURCE PENDING and it will become read-only. Notice that the audit process will stop.
Features
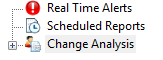
On the left side of the tool, we can find the following three main features:
“Real Time Alerts” allows creating alerts, which will listen for server and database object changes. Once we have set our preferences, we can set up an email for forwarding the alerts:

With “Scheduled Reports”, we can create schedules for sending the following reports:

Every server report allows choosing one or more of the following objects:

Every database report allows us to choose one or more of the following items:
The user interfaces are user-friendly. With few steps, we can simply create an alert or a report. This is one of the main advantages of the LepideAuditor for SQL Server tool.
As you can understand, any unwanted DROP can be immediately alerted and reported after a configuration made with two clicks.
The best feature is, for sure, the “Change Analysis” one. As the other user interfaces, it is very friendly. The dashboard let the user to get a big picture of the instance situation:
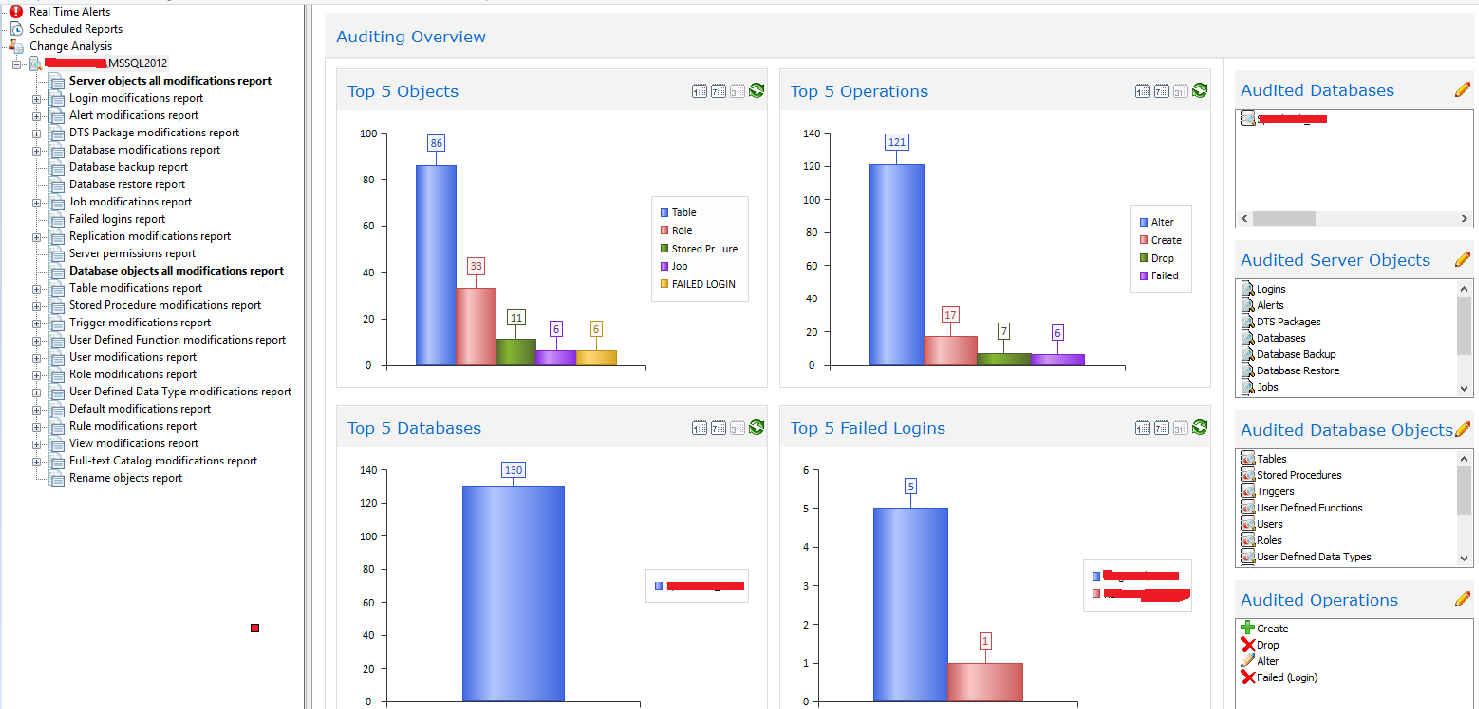
We can navigate the left treeview in order to drill on the instance detail. Under this node, we can find choose from a large set of options. For instance, we can choose to monitor alters on tables, logon o server, changes on stored procedures, and so on. For every selected option, a new dedicated view is shown. Whit these views we can filter out the results using a lot of parameters, like the operation type, the time range, the user, the application, the databases, and so on. These filters are very useful when many operations are logged.
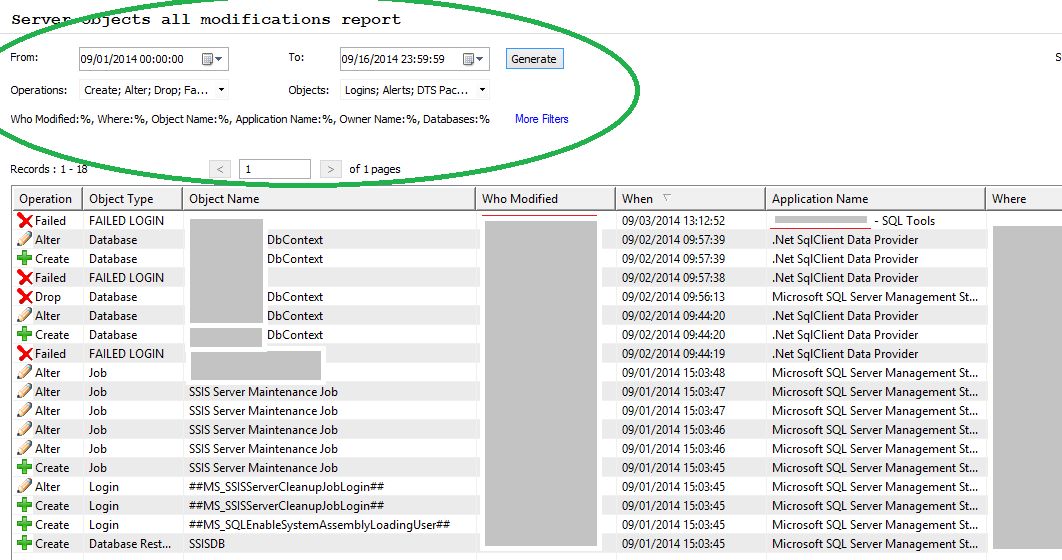
We can export the results grid in any format, like csv, html, pdf and we can send it via email.
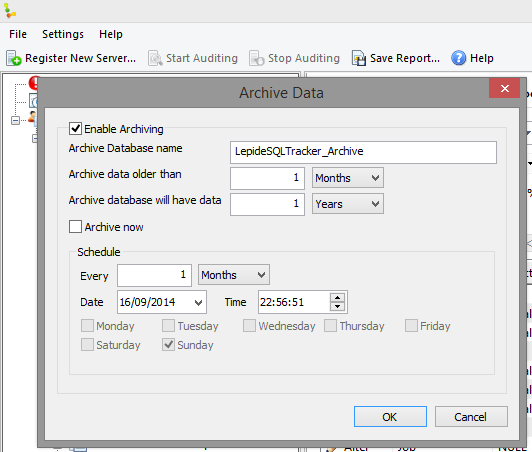
The target of these searches is the LepideSQLTracker database (by default). However, we can create an “Archive” database starting from the default one. The option “Settings”>”Archiving” allows us to move data using a realtime or scheduled snapshot.
Note: While LapideAuditor is listening on SQL Server Instance, SQL Server Management Studio (connected to the instance itself) can become slow. This is true especially when we have installed also third party add-ins which work on metadata and database data (i.e. source control managers, searches, etc).
Conclusions
LepideAuditor for SQL Server it’s definitely a good product to work with. Its usage must be evaluated and monitored in production environments (especially for the t-log growth, like any other database, consider to swith the recovery model). Let’s summarize pros and cons:
PROS
- Quick setup
- User friendly
- Complete coverage of auditing
- Automated management of the requirements (job + database)
- Good reporting and alerting system
- Scheduler for reporting
- Scaling out with archiving data
CONS
- Limitation when setting global auditing configurations (first described drawback)
- Sysadmin as a minimium requirement
- It may slow SSMS (to test with more environments).
You can download LepideAuditor for SQL Server here.

